How To Create a User-Interactive Graph of the Normal Distribution in Excel
How To Create a User-Interactive Graph of the Normal Distribution in Excel
Here is an easy-to-follow, step-by-step article showing you how to create a user-interactive graph in Excel of the Normal Distribution. Users will be able to vary the Normal Distribution's two parameters, the mean and standard deviation, and watch those changes be reflected in the Excel graph. This lesson will also show you how to graph the outer tails, for example, the outer 5% tails, a different color. The article includes a video so you can see exaclty how it is done.
Introduction To Creating an Interactive Graph of the Normal Distribution in Excel - Here Is the Final Graph You WIll Create
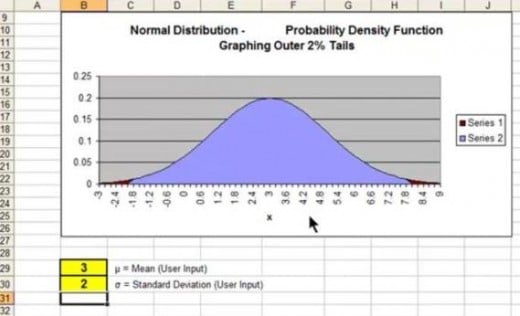
If you are doing statistical analysis of your marketing program, you will eventually want to plot some statistically-distributed data in an Excel graph. The most commonly-occurring statistical distribution in nature and, of course, in business, is the normal distribution.
Changing the Parameters Changes the Graph - Here Is the New Graph After Changing the User-Interactive Parameters

This article and video will show you how to create a user-interactive graph of the normal distribution in Excel. The user of your graph will be able to vary the two parameters of the Normal Distribution - the mean and standard deviation - and then watch the changes instantly reflected in the Excel graph. Note the differences between the graph above and the graph below as a result of changes in the 2 user inputs of mean and standard deviation.
Video - Show Step-By-Step How To Create User-Interactive Graph in Excel of the Normal Distribution - ( Is Your Sound Turned On? )
The concepts covered in this article really need to be observed in the video for full comprehension. Below is an outline of the major steps appearing in the video that are needed to construct a user-interactive graph in Excel of the Normal Distribution with highlighted outer tails.
Create the X-Axis - Creating the X-Axis and the Two Y Data Columns
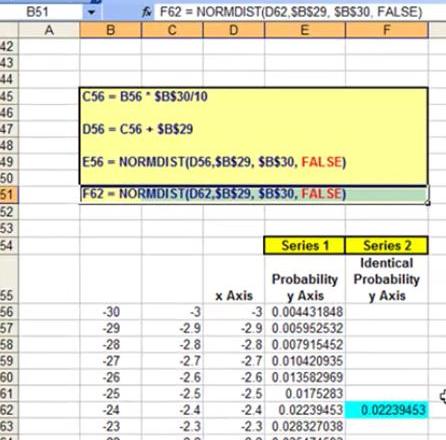
You'll notice on the video that when the user varies the mean or standard deviation inputs, it is the X-Axis that changes, not the graph. The graph will always show 3 standard deviations of normal distribution from the mean in both directions. It is the X-Axis increments that will change as a result of changes made by the user to the mean and standard deviation. The initial left-hand column starts at the top at -30 and finishes at the bottom at +30. This creates the basis of the 3 standard deviations of Normal Distribution that will show at all times on each side of the mean, regardless of the mean and standard deviation that the user has input.
2) Create 2 columns that will calculate the Normal Distribution's PDF at each point of the X-Axis - The Two Columns of Y-Axis Data
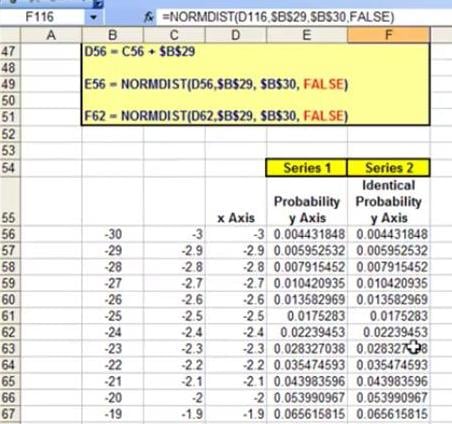
PDF is the Probability Density Function of the Normal Distribution. The data in each of these 2 columns are the Y values of two identical graphs, one sitting on top of the other.
3) Zero out the Y-Values on the outer edge(s) of the 2nd column to create the outer tails - Zeroing Out the 2nd Data Column To Create the Outer Tails
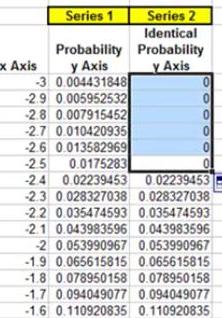
The 2nd column sits directly on top of the 1st column. If you set any the Y-values for that graph to 0, you allow the identical graph directly underneath to show through. For example, if you zero out the outer 2% of the Y-values on top and bottom of the 2nd column, you are allowing the lower graph to show through for the outer 2% of each tail. You are, in effect, graphing the outer 2% of the Normal Distribution by deleting the outer 2% of the tails in the upper graph, letting the different-colored lower graph to show.
4) Set the color of all elements on the Excel chart as you see best. - Setting the Color Elements
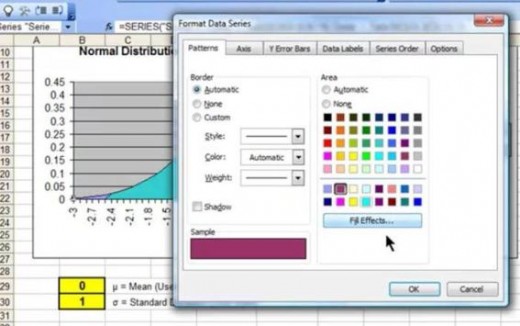
For example, you might want to change the color of the upper or lower graphs, or the color of the background. You simply left-click on the element that you wish to change the color of and then select the color in the color dialogue box that pops up. The video shows an example of this being done.
And There's the Final User-Interactive Graph of the Normal Distribution With Outer Tails - FInal Interactive Graph

By Far, The Clearest Graduate-Level Statistics Lessons - All In Excel! ---> Click On Image To See Reviews ! - The Excel Statistical Master eBook - Over 400 P

1) It's LOADED With Completed Problems ALL in Excel.
2) All Solved Problems Are REAL-WORLD, BUSINESS Problems.
3) Nothing But SIMPLE Explanations.
4) More Than Half of the Lessons Are Supplemented With VIDEOS To Help You Understand Quicker.
5) Lessons Are All in BITE-SIZE Chunks.
6) The Statistics Are MBA-LEVEL - Over 400 Pages and Videos.
7) All Lessons Are In CLEAR, EASY-TO-FOLLOW FRAMEWORKS.
8) NO USELESS THEORY Is Taught.
9) NO PRIOR STATISTICAL KNOWLEDGE Is Needed.
10) Every Lesson Is Entirely In Excel. NO LOOKING UP ON CHARTS.
11) You Already Know Excel. NO NEW SOFTWARE NECESSARY.
Wanna Be a Master of Business Statistics FAST ? Check Out My Other Lenses ! - My Other Lens That Will Make You a Master of Business Statistics - FAST !
- The 22 Most Common Mistakes Made During Statistical Analysis
If you make any of these mistakes, you'll either get a totally wrong answer or you will spend way more time than necessary getting to the right answer. - Excel's Easiest and Most Robust Normality Test - The Chi-Square Goodness-of-Fit Test
This Normality test is very easy to implement in Excel. This lens explains in easy-to-follow instructions exactly how to perform the test and also how the Chi-Square Goodness-Of-Fit Test actually works. - The 7 Biggest Reasons That Your Data Is Not Normally Distributed
Here is a list of the main (but correctable) reasons that your data does not appear to be normally distributed. If your data is normally distributed, you can perofrm most statistical tests on that data. This lens tells you why your data doesn't appea - How To Use Dummy Variable Regression in Excel To Do Conjoint Analysis
Conjoint Analysis is a great marketing technique that will tell which products attributes your customers like the best and also quantifies the customers' degree of liking of each attribute. This lense shows exactly how to do it in Excel. This lens ha - Taguchi Testing - Is It a Good Tool For Landing Page Optimization?
This lens explains in simple terms exactly what Taguchi testing is and why it is or is not a good tool for landing page optimzation. - How To Create a User-Interactive Graph Of the Normal Distribution in Excel
You will see in step-by-step, easy-to-follow lessons, which includes a video, exactly to create a user-interactive graph of the normal distribution in Excel. The user will be able to vary the mean and standard deviation and watch those changes reflec - How To Use the t Test in Excel To Tell If Your New Marketing Is Working
The t Test is the easiest tool in the world to tell if your new marketing or advertising campaign really worked. Here's how to do it in Excel. - How To Find Out What Makes Your Customers Buy WIth the Chi-Square Independence Test In Excel
The Chi-Square Indepedence Test is a versatile test for determining if one thing is related to the other.l Here's how to do it in Excel, This lens has a video in it to make it easy to understand. - How To Quickly Read the Output of Regression in Excel
The output of regression in Excel in complicated. Here is how to quickly look at this output and identify the 4 main, important parts and what they mean. This lens has a video in it for easier understanding. - Download the 400+ Page eManual About How To Do Business Statistics in Excel
The 400+ page eManual, The Excel Statistical Master, simplfies business statistics by presenting everything in frameworks that are easy-to-follow and easy-to-duplicate. Loaded with worked-out problems, this eManual focuses on solving real-world busin
Links To Learn Business Statistics At a More Basic Level - These Lessons Are Easy-To-Follow ! - Business Statistics Made SIMPLE - For Those Who Don't Speak Math
If you are interested in learning business statistics quickly and being able to solve real-world statistics problems, these links are for you.
- Confidence Intervals For the Business Manager
Confidence Intervals made easy-to-understand for the business manager. Lots of solved problems. Each problems solved with a step-by-step framework that you will be able to duplicate and use quickly. No wasting time with academic theory that is not us - The Normal Distribution For the Business Manager
How to use the Normal Distribution to solve real-world business problems. Lots of worked-out problems solved with and easy-to-follow- step-by-step framework. The emphisis is entirely on solving problems with no time wasting on complicated acedemic th - Prediction Using Regression For the Business Manager
Regression analysis has a lot of important uses in business. This lesson show you in detail how to perform regression without confusing you. Loaded with solved problems, this lesson teaches regression in an easy-to-follow, step-by-step method that yo - How To Solve ALL Hypothesis Tests in Only 4 Steps in Excel
This lesson presents a framework that shows you show to solve ALL of the many kinds of hypothesis tests in only 4 steps in Excel. Extremely useful ! - The t Distribution For the Business Manager
The t Distribution is often used for analyzing small samples. It is very close to the normal distribution but very useful when sample size is less than 30. - Combinations and Permutations for the Business Manager - With Lots of Worked-Out Problems !
Combinations and Permutations are extremely useful statistical tools. Anyone who does statistical analysis should know them. - Correlation and Covariance For the Business Manager - With Lots of Worked-Out Problems !
Correlation and Covariance describe linear relationships between different variables. It allows you to quickly determine to what degree the movement of one object is related to the movement over another object. - The Binomial Distribution For the Business Manager - With Lots of Worked-Out Problems !
The Binomial Distribution is one of the most valuable and commonly used statistical tools. The Binomial Distribution is used whenever a process has only two possible outcomes. This is a very common occurrence. - ANOVA for the Business Manager - With Lots of Worked-Out Problems !
ANOVA, Analysis of Variance, is a test to determine whether the means of several groups are equal. As such, ANOVA is often used to determine if three or more different methods or treatments have the same effect on a population. For example, ANOVA tes - Other Useful Distributions For the Business Manager - With Lots of Worked-Out Problems !
Learn how many other distributions, such as the Weibull and the Poisson Distributions can be used in business. - Download the 400+ Page eManual About How To Do Business Statistics in Excel
The 400+ page eManual, The Excel Statistical Master, simplfies business statistics by presenting everything in frameworks that are easy-to-follow and easy-to-duplicate. Loaded with worked-out problems, this eManual focuses on solving real-world busin

